



Reverse Proxy Benchmark 2026: Caddy, Traefik, Nginx Proxy Manager and Zoraxy Compared
How many users can a reverse proxy handle on a small VPS? Caddy, Traefik, Nginx Proxy Manager and Zoraxy tested with 1 and 4 vCPU, real HTTPS certificates and charts.
Contents
Caddy 2.11.8Traefik 3.7.17Nginx Proxy Manager 2.16.0Zoraxy 3.3.4Docker 29.9.3Debian 13You usually pick a reverse proxy by how you want to operate it: web interface, text file or Docker labels. Speed rarely matters, and that is fine. Still, I wanted to know how much load these four proxies really carry on a small VPS and where they start to stumble. So I ran Caddy, Traefik, Nginx Proxy Manager (NPM) and Zoraxy against each other on servers, with real HTTPS and default settings.
I don’t ask for the maximum request rate, I ask how many users a server still carries while responses stay fast enough. I added tests with realistic, fixed load, because peak numbers alone say little about everyday use.
Results in short
- Under normal load all four are equally fast. At 1,500 requests per second (about 15,000 concurrent users) Caddy, NPM and Zoraxy answer in under 2 ms at P95 on a 1 vCPU server.
- For peak values Traefik leads, Zoraxy follows, and Caddy reaches about half of Traefik.
- With new TLS connections the key type of the certificate decides most of the result. The defaults range from ECDSA P-256 (Caddy) to RSA 4096 (Traefik) and skew the comparison by up to a factor of 10.
- In a default install NPM has a hard limit at about 430 requests per second, because it does not reuse connections to the backend. One line in the Compose file raises it by a factor of 20.
- In memory use, Caddy (13 MB idle) and Zoraxy (104 MB) are almost a factor of 8 apart.
How I tested
Servers and setup
All servers sat in Falkenstein on the same private network, so the internet does not take part in the measurement:
| Role | Type | Specs |
|---|---|---|
| Proxy (small) | Hetzner CPX12 | 1 vCPU, 2 GB RAM |
| Proxy (large) | Hetzner CPX32 | 4 vCPU, 8 GB RAM (the same server, upgraded) |
| Backend | Hetzner CPX32 | 4 vCPU, 8 GB RAM, nginx 1.30 |
| Load generators | 2 to 4× Hetzner CPX42 | 8 vCPU, 16 GB RAM each |
I upgraded the proxy server between runs. Exactly one proxy ran on the server at a time, the others were stopped. The order was NPM, Zoraxy, Traefik, Caddy. I therefore can’t rule out fluctuating neighbour load at Hetzner.
The backend serves two static files: a 1 KB JSON response and a 1 MB file. A slow backend would hide the proxy, so I kept it deliberately trivial.
The proxies
Every proxy ran as a Docker container with a pinned image version and default settings. Each got a real Let’s Encrypt certificate for its domain and forwards to the backend over plain HTTP:
| Proxy | Version | Configuration |
|---|---|---|
| Caddy | 2.11.8 | reverse_proxy in the Caddyfile, certificate automatic |
| Traefik | 3.7.17 | File provider with one router, HTTP challenge |
| Nginx Proxy Manager | 2.16.0 | Proxy host and certificate created through the API |
| Zoraxy | 3.3.4 | Proxy rule and certificate created through the API, no login |
Before every run my script checks that all four serve byte-identical files.
Load generator and metrics
The load comes from vegeta. The generator sends at a constant rate and does not wait for slow responses. That way we also see when a proxy falls behind. The load is spread over two to four load generators, so the generator itself does not become the bottleneck.
A simulated user produces 0.1 requests per second on average. 1,000 requests per second therefore equal 10,000 users. That is a conversion, not simulated user behaviour with think times.
A test counts as passed when all three conditions hold:
- P95 latency is under 500 ms.
- P99 latency is under 1 second.
- The error rate is under 1 %.
The proxy must also actually deliver at least 97 % of the requested rate.
The search for the limit is a binary search: I start at a low rate and double it until a step fails, then I halve the interval down to 8 % precision. Each step takes 30 seconds, and the first 6 are discarded. After that, the rate I found has to pass three times in a row for 75 seconds each. If a run fails, I go down 8 % and start over. After every failed step I wait 100 seconds so ports and connection tables can drain. Without that pause, an overloaded step skews the next one.
The three scenarios:
- Small response, connections stay open. The normal case: browsers keep connections open, TLS is negotiated only once.
- New TLS connection per request. The opposite: every request sets up the connection and the TLS handshake from scratch. That is harsh, but it shows what happens when many new visitors arrive at once.
- A 1 MB file. Here throughput counts.
Scenario 1: Small response over HTTPS
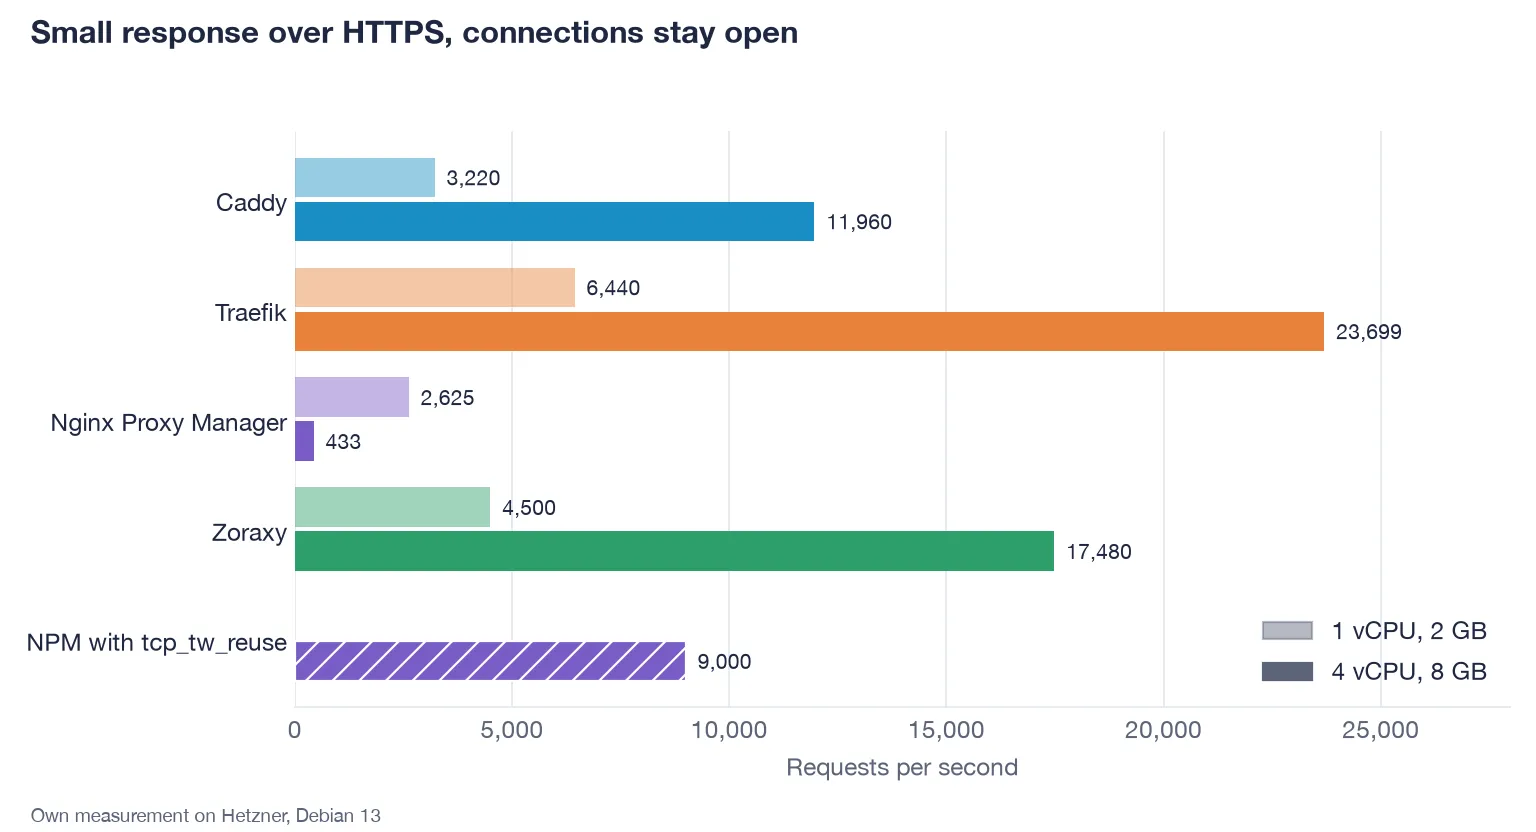
| Proxy | 1 vCPU | Median | 4 vCPU | Median |
|---|---|---|---|---|
| Traefik | 6,440 | 149 ms | 23,699 | 28 ms |
| Zoraxy | 4,500 | 229 ms | 17,480 | 2 ms |
| Caddy | 3,220 | 1 ms | 11,960 | 1 ms |
| Nginx Proxy Manager | 2,625 | 1 ms | 433 (with tcp_tw_reuse: 9,000) |
2 ms (2 ms) |
All values are requests per second. The median is the typical response time at exactly that rate. Multiplied by ten, the rate gives the user equivalents. On 4 vCPU Traefik reaches up to 237,000 user equivalents, Caddy about half of that.
Two observations I want to add:
- Traefik and Zoraxy are already queueing at their limit. On the small server their median was 149 and 229 ms there, against 1 ms for Caddy and NPM (see table). For those two the peak rate is a boundary where the proxy only just passes, not a comfortable rate for continuous operation.
- Caddy drops off abruptly at its limit. At 11,960 requests per second the server was only about 52 % busy, at 14,000 throughput suddenly fell below 2,000. I did not investigate the cause. My suspicion is a bottleneck when opening connections to the backend, where Caddy keeps only a few connections open by default. I did not measure that, so I give it as a guess.
Scenario 2: New TLS connection per request
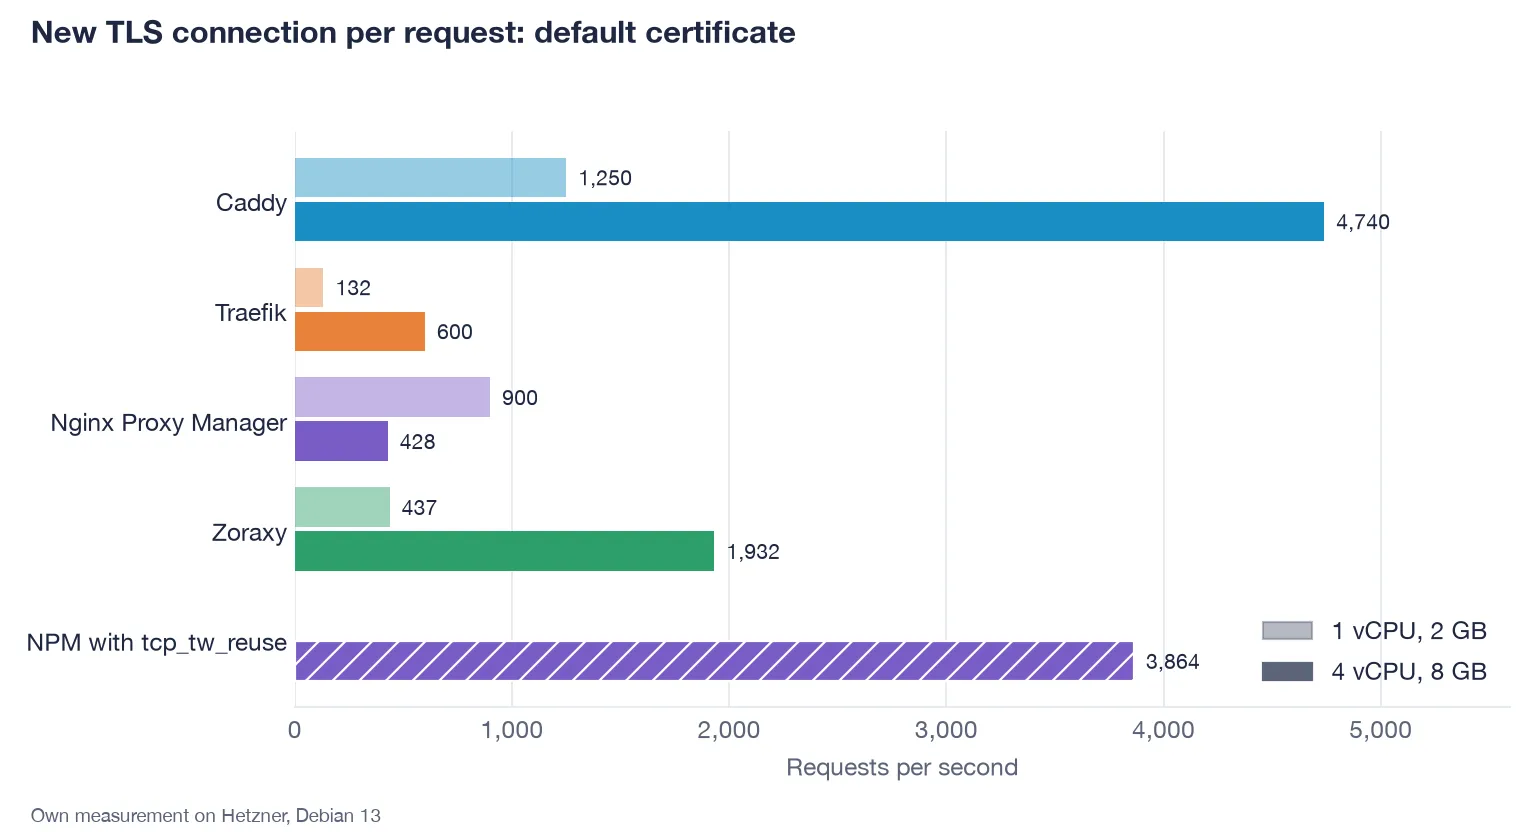
| Proxy | 1 vCPU | Median | 4 vCPU | Median |
|---|---|---|---|---|
| Caddy | 1,250 | 12 ms | 4,740 | 11 ms |
| Nginx Proxy Manager | 900 | 70 ms | 428 (with tcp_tw_reuse: 3,864) |
15 ms (11 ms) |
| Zoraxy | 437 | 14 ms | 1,932 | 16 ms |
| Traefik | 132 | 34 ms | 600 | 40 ms |
Here Traefik suddenly looks weak: 132 instead of 6,440. The explanation is not the proxy but the certificate. With default settings each proxy issues a different key type:
| Proxy | Key in the certificate |
|---|---|
| Caddy | ECDSA P-256 |
| Nginx Proxy Manager | ECDSA P-384 |
| Zoraxy | RSA 2048 |
| Traefik | RSA 4096 |
On every handshake the server has to sign with the key, and an RSA signature is far more expensive than an ECDSA one. RSA 4096 is clearly slower than RSA 2048, as the values above show: Zoraxy (RSA 2048) reached 1,932, Traefik (RSA 4096) 600. So I repeated the test with the same P-256 certificate for all four, using a self-signed certificate that I loaded into each proxy:
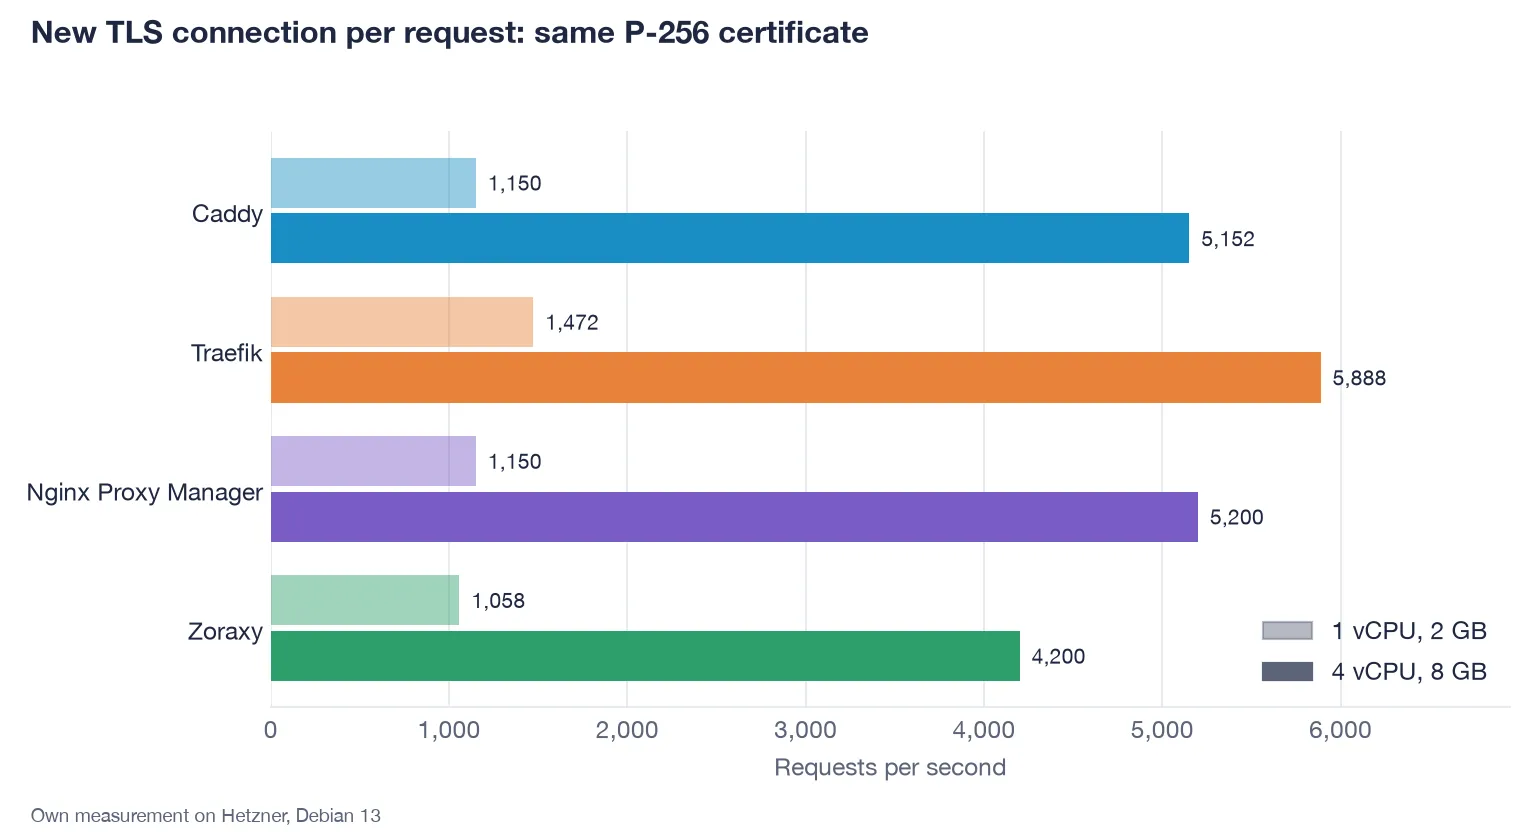
| Proxy | 1 vCPU | Median | 4 vCPU | Median |
|---|---|---|---|---|
| Traefik | 1,472 | 4 ms | 5,888 | 4 ms |
| Nginx Proxy Manager | 1,150 | 13 ms | 5,200 | 5 ms |
| Caddy | 1,150 | 4 ms | 5,152 | 4 ms |
| Zoraxy | 1,058 | 23 ms | 4,200 | 8 ms |
With the same certificate all four are close together. For NPM I set tcp_tw_reuse here, because otherwise the connection limit from the next section would have skewed the comparison.
What does that mean for you? If a proxy feels slow when opening connections, check the key type first. In Traefik you can switch the type in the resolver configuration (according to the documentation with keyType: EC256). I did not test that. With Caddy you don’t need to do anything, ECDSA P-256 is already the default.
Scenario 3: Large file
| Proxy | 1 vCPU | Median | 4 vCPU | Median |
|---|---|---|---|---|
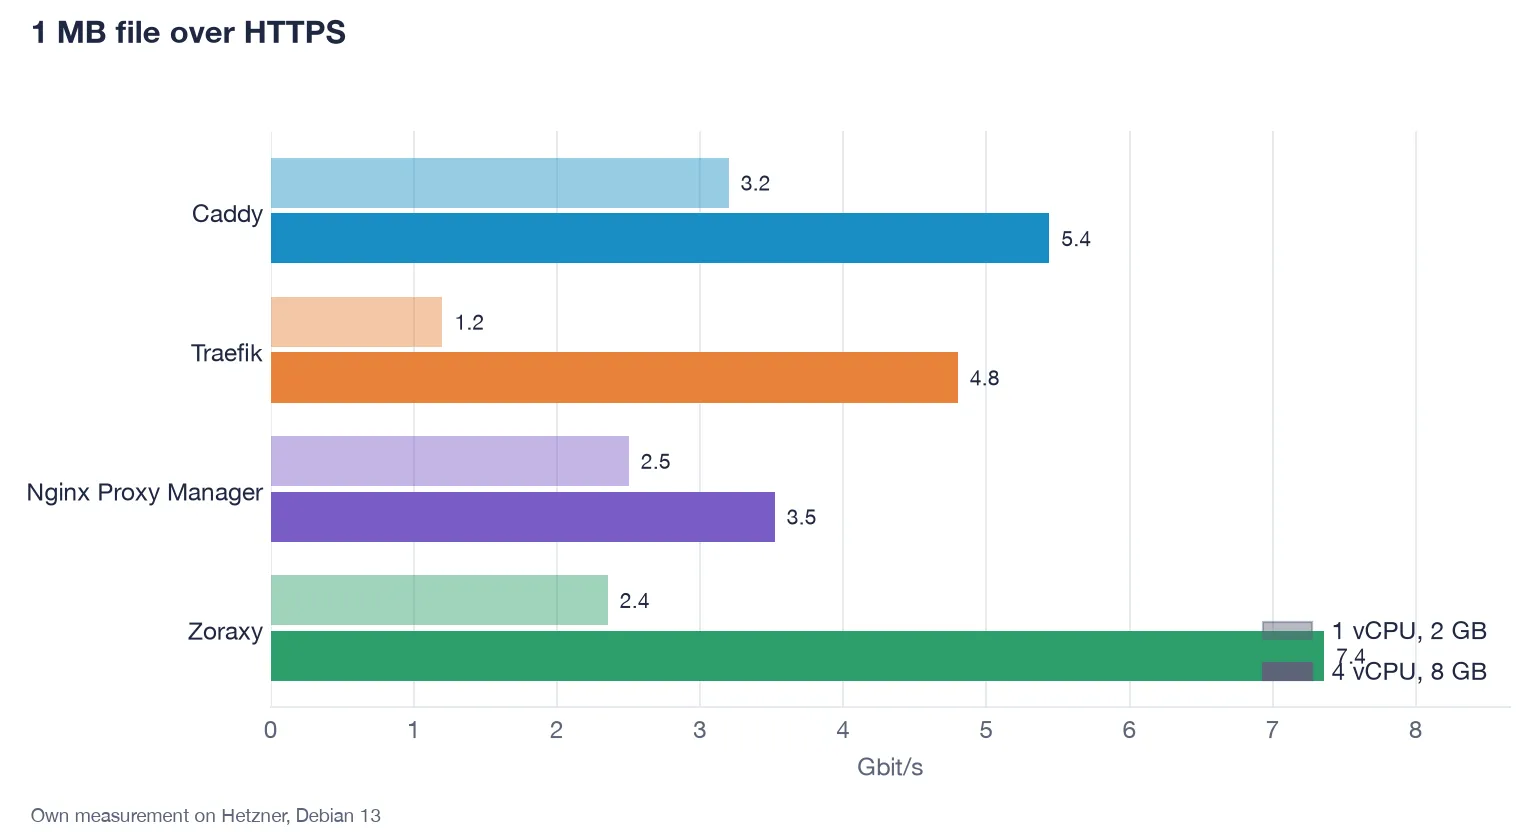
| Zoraxy | 294 (2.4 Gbit/s) | 4 ms | 920 (7.4 Gbit/s) | 5 ms |
| Caddy | 400 (3.2 Gbit/s) | 10 ms | 680 (5.4 Gbit/s) | 5 ms |
| Traefik | 150 (1.2 Gbit/s) | 4 ms | 600 (4.8 Gbit/s) | 5 ms |
| Nginx Proxy Manager | 313 (2.5 Gbit/s) | 10 ms | 440 (3.5 Gbit/s) | 8 ms |
The numbers are requests per second for the 1 MB file. For home servers this is academic: your connection is slower than any of these values. It does show that when passing large responses through, the core count matters, and that on a single core Traefik reaches only about half of Caddy.
Scaling from 1 to 4 cores
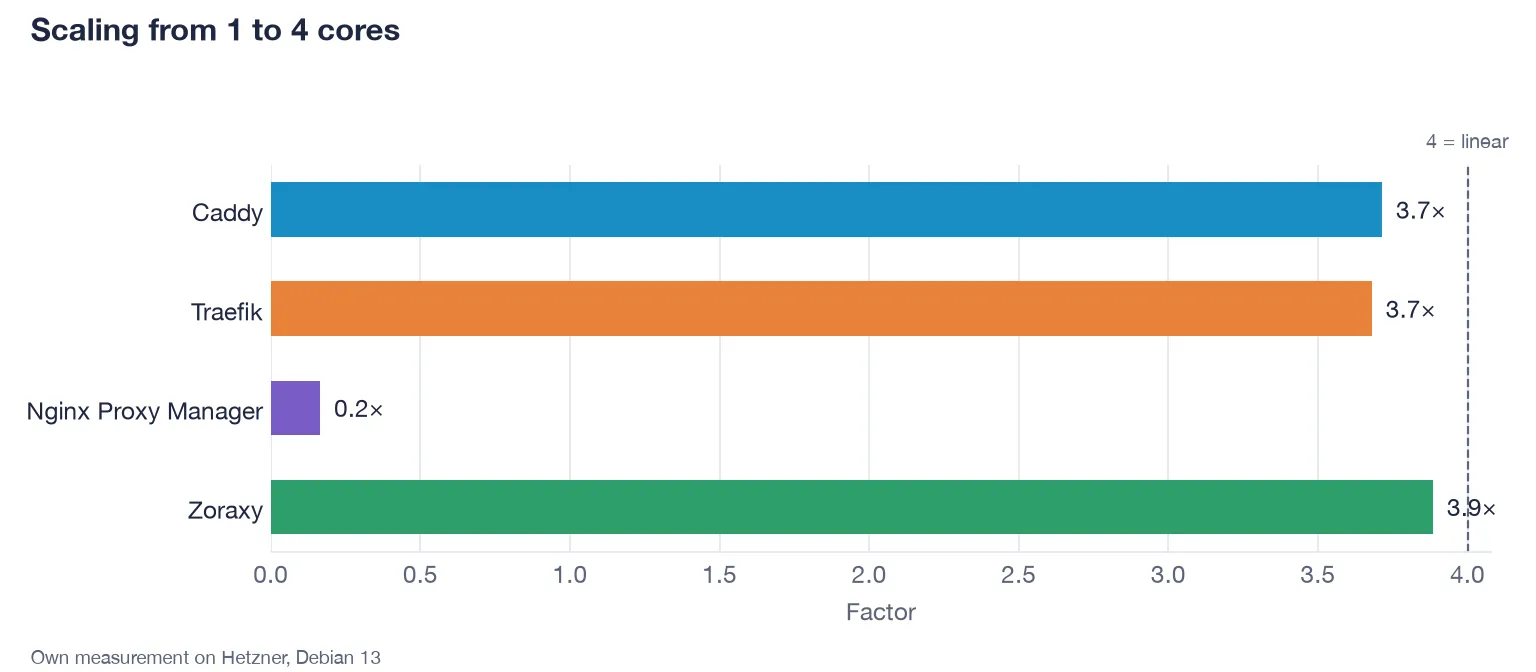
With a small response, Caddy, Traefik and Zoraxy scale almost linearly: with four cores they reach 3.7 to 3.9 times the throughput. An upgrade from 1 to 4 vCPU gives these three almost four times the throughput. For NPM in a default install it brings nothing, the opposite in fact, and the next section explains why.
The NPM special case: 430 requests per second
On the small server NPM reached 2,625 requests per second, on the large one only 433, with 502 Bad Gateway and this entry in the error log:
connect() to 10.0.0.2:80 failed (99: Cannot assign requested address) while connecting to upstreamThe cause: NPM opens a new connection to the backend for every request instead of reusing connections. Every closed connection stays in the TIME_WAIT state for 60 seconds and occupies one of the roughly 28,000 free ports of the container. 28,000 ports divided by 60 seconds gives about 470 new connections per second. Above that the ports run out.
The small server still reached 2,625 because of a quirk of the kernel: Linux allows only as many TIME_WAIT entries as memory permits (tcp_max_tw_buckets). With 2 GB that is 8,192, with 8 GB it is 32,768. On the small server the kernel therefore discards the entries immediately and the ports free up quickly. On the large server all of them stay occupied for 60 seconds.
The fix is one line in the Compose file. With tcp_tw_reuse the kernel may reuse ports from TIME_WAIT:
services:
  npm:
    image: jc21/nginx-proxy-manager:2.16.0
    sysctls:
      - net.ipv4.tcp_tw_reuse=1
    ports:
      - "80:80"
      - "443:443"
      - "81:81"
With that NPM went from 433 to 9,000 requests per second for JSON on the large server, and from 428 to 3,864 for new connections.
Realistic load: what do the proxies use day to day?
Peak values say little about everyday use. So I also ran every proxy under fixed, moderate load: 1,500 requests per second (15,000 user equivalents) for 2 minutes each, twice. On the large server 5,000 requests per second came on top.
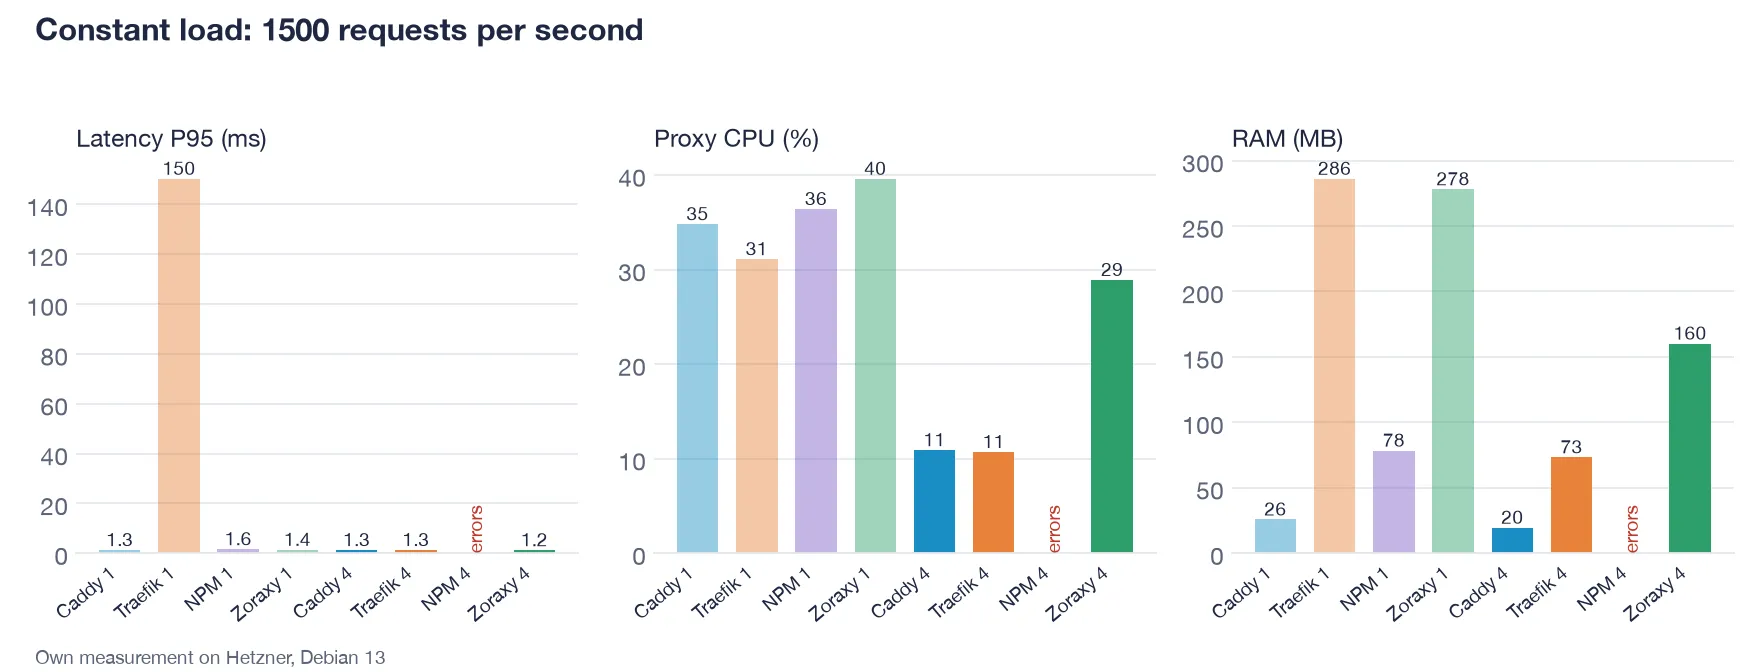
At 1,500 requests per second and 1 vCPU:
| Proxy | Median | P95 | CPU | RAM |
|---|---|---|---|---|
| Caddy | 0.9 ms | 1.3 ms | 33 to 35 % | 26 MB |
| Nginx Proxy Manager | 1.2 ms | 1.6 ms | 36 % | 78 MB |
| Zoraxy | 0.9 ms | 1.3 to 1.4 ms | 35 to 40 % | 278 MB |
| Traefik | 0.9 ms | 144 to 150 ms | 27 to 31 % | 286 MB |
At 4 vCPU and 1,500 requests per second:
| Proxy | Median | P95 | CPU | RAM |
|---|---|---|---|---|
| Caddy | 1.0 ms | 1.2 to 1.3 ms | 10 to 11 % | 20 MB |
| Traefik | 1.0 ms | 1.3 ms | 10 to 11 % | 73 MB |
| Zoraxy | 1.0 ms | 1.2 ms | 12 to 29 % | 160 MB |
| Nginx Proxy Manager | 2,400 ms | Errors on 44 % of requests | 97 % | 126 MB |
At 5,000 requests per second on 4 vCPU Caddy stays at 29 % CPU and 29 MB RAM. Zoraxy then needs 46 % CPU and about 430 MB, Traefik 34 % CPU and about 610 MB. NPM without the setting fails half the requests.
Three things stand out:
- Under everyday load there are no real differences. All four answer in about one millisecond at the median.
- Memory use differs a lot. At idle Caddy uses 13 MB, Traefik 22 MB, NPM 71 to 74 MB and Zoraxy 104 MB. Under load mainly Traefik grows: to about 610 MB at 5,000 requests per second. On a VPS with 2 GB you notice that, on a server with 8 GB it doesn’t matter.
- On a single core Traefik shows a conspicuous P95 of around 140 ms even though the median is 1 ms. It appeared at 500 and 1,500 requests per second in all four runs. On 4 vCPU it disappears at 1,500, at 5,000 the first run still had 118 ms. I did not find the cause. If you run Traefik on a single-core server, keep an eye on this.
What the test does not show
- The backend is deliberately trivial. With a real application the proxy is almost never the bottleneck.
- Everything runs in Docker with a bridge network. That costs all four the same, but it is not the same as a proxy directly on the host.
- Default settings. All four can be tuned, and I tuned nothing. The two exceptions are the P-256 certificate in part of the handshake test and
tcp_tw_reusefor NPM. - One measurement per size and proxy. Plus the three confirmation runs. I expect about 10 % noise. Don’t read too much into small gaps between the proxies.
- Not measured: HTTP/3, WebSockets, reloading the configuration under load and multiple backends.
- The load generators were under 40 % CPU in most runs. In the handshake test with the P-256 certificate they reached up to 78 %. I added more generators for that.
You can find an earlier benchmark with NPM, NPM+ and Zoraxy in the post Reverse Proxy Benchmark 2025. It uses different tools and a different scenario, so the numbers are not directly comparable.
What I take away from this
Speed should rarely decide for you. All four reach many times what a home server or a small website needs on a small VPS. These points matter more:
- Caddy is my favourite if you want a short text file and low memory use. The setup is in the post Caddy Reverse Proxy with Docker. At very high load Caddy was slower than Traefik and Zoraxy in this test, but you only notice that with tens of thousands of users.
- Traefik fits if you want Docker containers detected automatically. The guide is in the post Traefik with Docker. Plan for a bit more memory and change the key type if needed.
- Nginx Proxy Manager is still the easiest choice with an interface. Under heavy load, set the
sysctlsline from this post. - Zoraxy is fast and has an interface, but needs more memory at idle than the others.
If you don’t have your own public IPv4 address, a tunnel helps more than any of these proxies, for example with Pangolin.
Frequently asked questions
Which reverse proxy is the fastest?
With connections that stay open, Traefik led with 23,699 requests per second on 4 vCPU, followed by Zoraxy with 17,480, Caddy with 11,960 and NPM with default settings at 433. With new TLS connections and the same certificate all four are within about 30 % of each other. In everyday use the difference does not matter.
Why was Traefik so slow at the TLS handshake?
By default Traefik issues a certificate with an RSA 4096 key. That is much more expensive on every handshake than ECDSA P-256, which Caddy uses. With the same P-256 certificate Traefik actually reached the highest value in my test, 5,888 instead of 600 requests per second.
Why does Nginx Proxy Manager break down at about 430 requests per second?
NPM opens a new connection to the backend for every request. The closed connections occupy a port for 60 seconds, and a container has only about 28,000 of them. Set net.ipv4.tcp_tw_reuse=1 through sysctls in the Compose file, and in my test NPM reached 9,000 requests per second on 4 vCPU.
How many users can a reverse proxy handle on a small VPS?
On a server with 1 vCPU and 2 GB, Caddy, Traefik and Zoraxy handled 3,000 to 6,000 requests per second, which equals roughly 30,000 to 64,000 user equivalents at 0.1 requests per second each. That holds for a trivial backend. With a real application, its load is the bottleneck.
Is a bigger server worth it for the reverse proxy?
For Caddy, Traefik and Zoraxy the jump from 1 to 4 vCPU brought almost four times the throughput. For most home servers and small websites that is unnecessary, because the proxy needs little CPU under normal load. At 1,500 requests per second Caddy on 4 vCPU sat at about 10 % CPU.
How much memory does a reverse proxy need?
At idle Caddy used about 13 MB, Traefik 22 MB, Nginx Proxy Manager 71 to 74 MB and Zoraxy 104 MB. Under high load the need grew to about 610 MB for Traefik and about 430 MB for Zoraxy, and only to 29 MB for Caddy.
Can I repeat the measurement myself?
Yes. You need one server with the proxy, a second with a fast static backend and a third for the load, for example with vegeta. What matters is the private network, one proxy at a time and a look at the load generator's CPU so it does not become the bottleneck itself.
Conclusion
Speed is not a selection criterion for a home server among these four reverse proxies. Even a server with a single core carries many times what you need. The real differences lie elsewhere: Caddy gets by with the least memory, Traefik reaches the highest rate with open connections, and anyone expecting many requests with NPM should add a single line to the Compose file. The TLS handshake values mostly show how strongly a default such as the key type can change a measurement.
Use the proxy whose operation suits you. If you like, tell me in the comments which one you use and whether you have run into one of these limits yourself.