VPS Benchmark Test: 8 Affordable Servers Compared (2021)
Eight budget VPS under €10/month benchmarked with Sysbench, Geekbench, FIO, and iperf. See how Hetzner and Netcup compare in CPU and I/O performance. Full results.

Table of Contents
CAUTION
Please note that I originally wrote this blog post in German. This translation is for your convenience. Although every effort has been made to ensure accuracy, there may be translation errors. I apologize for any discrepancies or misunderstandings resulting from the translation. I am grateful for any corrections in the comments or via mail.
Benchmark tests don’t tell you everything about server performance. When evaluating a provider, completely different criteria play a decisive role: uptime, support, value for money. Still, I wanted to benchmark a few smaller VPS to see how big the differences really are. The results don’t indicate service quality or long-term performance.
I ran two rounds of tests: mid-2021 with manual tools (Sysbench, 7zip, Geekbench, Phoronix) and late 2021 with the Yet-Another-Bench-Script, which runs FIO, iperf and Geekbench automatically.
Key Takeaways
- Hetzner CX11 and Netcup RS 1000 G9 delivered the best CPU results in both test rounds (Geekbench single-core above 1,000 points)
- In the FIO I/O test, the Hetzner CX11 in Helsinki reached up to 121 MB/s at 4k blocks, while the 1blu VPS R8 only managed 59 MB/s
- All tested servers cost under €10/month; for basics on choosing a VPS, check the VPS beginner guide
- iperf tests showed Hetzner leading network performance by a wide margin (partially over 5 Gbit/s)
Tested Servers
Mid-2021
| Provider | Name | CPU | RAM | Storage |
|---|---|---|---|---|
| 1blu | VPS R8 | 4x EPYC 7502 | 8 GB | 120 GB SSD |
| Contabo | VPS S SSD | 4x Xeon E5-2630 | 7.77 GB | 200 GB SSD |
| Hetzner* | CX11 | 1x Xeon | 1.89 GB | 20 GB SSD |
| Hetzner* | CPX11 | 2x EPYC | 1.89 GB | 40 GB SSD |
| Netcup* | VPS 200 G8 | 1x QEMU Virtual CPU | 1.94 GB | 20 GB SSD |
| Netcup* | VPS 1000 G9 | 2x QEMU Virtual CPU | 8 GB | 160 GB SSD |
| Netcup* | RS 1000 G9 | 2x AMD EPYC 7702P | 7.78 GB | 160 GB SSD |
| RackNerd* | LEB Special 3.5 KVM | 3x Xeon E5-2690 | 3.35 GB | 45 GB SSD |
These aren’t identical servers, but the results may still be interesting. All servers in this list cost less than €10 per month. I also included my local Intel NUC BOXNUC7CJYH2 Celeron J4005 (Amazon Affiliate Link) with G.Skill 2x4GB RAM (Amazon Affiliate Link) and a Crucial MX500 500GB SSD (Amazon Affiliate Link) in the comparison.
Late 2021
| Provider | Name | CPU | RAM | Storage |
|---|---|---|---|---|
| 1blu | VPS R8 | 4x EPYC 7502 | 8 GiB | 120 GB SSD |
| Contabo | VPS S SSD | 4x Xeon E5-2630 | 7.8 GiB | 200 GB SSD |
| Hetzner* | CX11 (Nuremberg) | 1x Xeon | 1.89 GB | 20 GB SSD |
| Hetzner* | CX11 (Falkenstein) | 1x Xeon | 1.89 GB | 20 GB SSD |
| Hetzner* | CX11 (Helsinki) | 1x Xeon | 1.89 GB | 20 GB SSD |
| Netcup* | VPS 200 G8 | 1x QEMU Virtual CPU | 1.94 GB | 20 GB SSD |
| Netcup* | RS Black | 2x AMD EPYC 7702P | 11.7 GB | 160 GB SSD |
| RackNerd* | LEB Special 3.5 KVM | 3x Xeon E5-2690 | 3.35 GB | 45 GB SSD |
The servers are mainly located in Germany. I rented the CX11 from Hetzner three times: once in Nuremberg, once in Falkenstein, and once in Helsinki (Finland). No server here costs more than €10 per month either.
Benchmarks Mid-2021: Manual Tests
Test Preparation
I install a fresh Ubuntu 20.04 on the VPS (and on the Intel NUC), then connect to the server and update it.
apt update
apt upgrade
Then I install the benchmark tools I want to use for the tests.
Installing Sysbench
apt install sysbenchInstalling 7zip
apt install p7zip-fullInstalling Geekbench
wget https://cdn.geekbench.com/Geekbench-5.4.1-Linux.tar.gz
tar xf Geekbench-5.4.1-Linux.tar.gz
Installing Phoronix Test Suite
apt install gdebi-core
wget http://phoronix-test-suite.com/releases/repo/pts.debian/files/phoronix-test-suite_10.4.0_all.deb
gdebi phoronix-test-suite_10.4.0_all.deb
phoronix-test-suite install john-the-ripper
phoronix-test-suite install nginx
Restart
Finally, I restart the server once.
rebootTest Execution
Sysbench
I used Sysbench to test CPU, RAM and SSD. Each test ran three times to reduce the impact of deviations. I ran four different tests with one, two and four threads respectively, regardless of whether multiple CPU cores were available.
sysbench cpu --threads=1 run
sysbench cpu --threads=2 run
sysbench cpu --threads=4 run
I noted the events per second.
sysbench memory --threads=1 run
sysbench memory --threads=2 run
sysbench memory --threads=4 run
I noted the operations per second.
sysbench fileio prepareThis isn’t a test itself, I only ran it once, but I noted the write speed anyway.
sysbench fileio --threads=1 --file-test-mode=seqwr run
sysbench fileio --threads=2 --file-test-mode=seqwr run
sysbench fileio --threads=4 --file-test-mode=seqwr run
I noted the written MiB/s.
sysbench fileio --threads=1 --file-test-mode=rndrw run
sysbench fileio --threads=2 --file-test-mode=rndrw run
sysbench fileio --threads=4 --file-test-mode=rndrw run
I noted the read MiB/s and written MiB/s.
7zip
With 7zip I ran the standard benchmark test once and compared the average MIPS for compression and decompression. This test also ran with one, two and four cores.
7z b -mmt1
7z b -mmt2
7z b -mmt4
Geekbench
In the extracted folder I ran the Geekbench script.
cd Geekbenchfolder
./geekbench5
Phoronix Test Suite
With Phoronix I ran both previously installed tests.
phoronix-test-suite run john-the-ripper
phoronix-test-suite run nginx
I selected Blowfish for John-the-ripper.
Results Mid-2021
Sysbench CPU
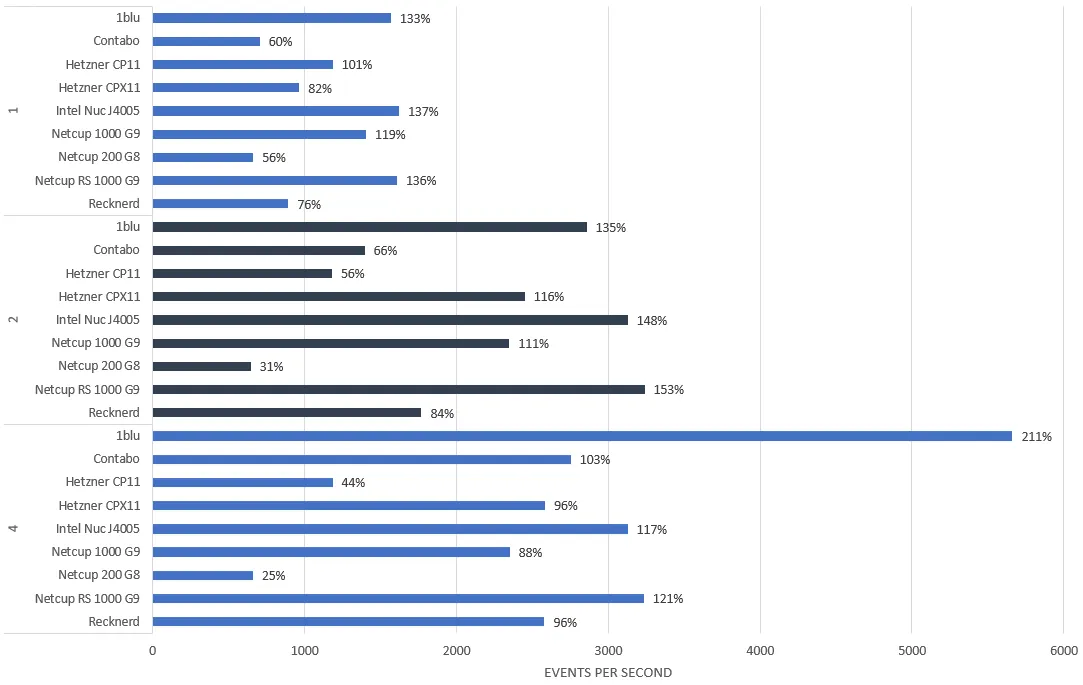
In the CPU test with Sysbench limited to one thread, my Intel NUC achieved the best results. As soon as two threads were allowed, it was narrowly overtaken by the Netcup root server. With four threads, the 1blu server delivered a significantly better result than the rest.
Sysbench Memory
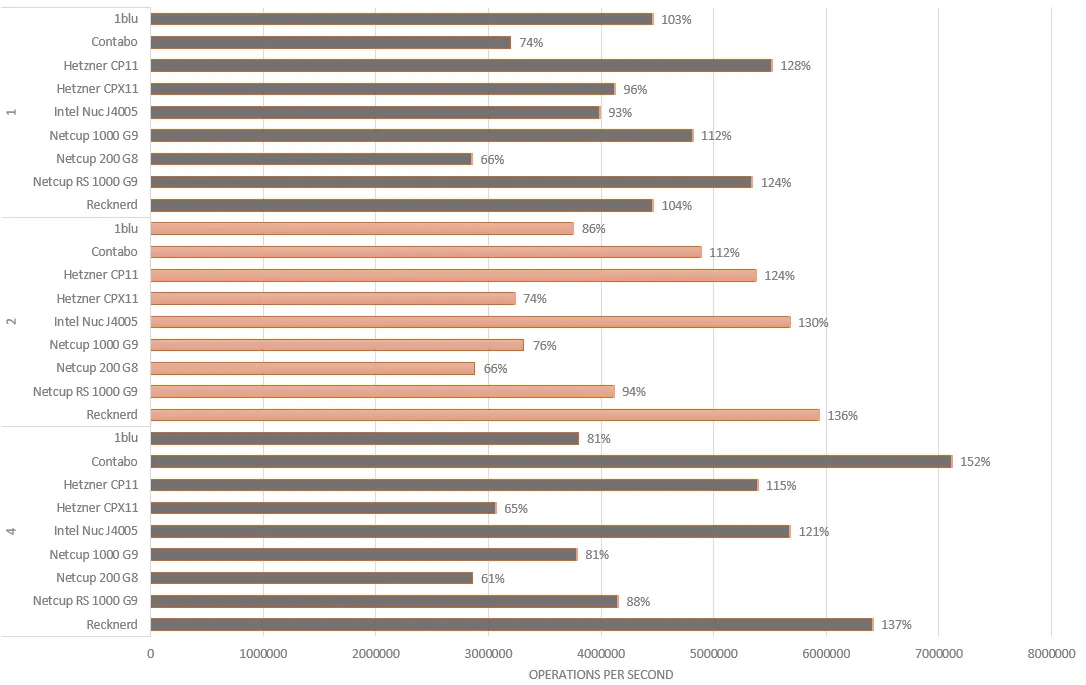
The memory test had a different winner depending on thread count. With one thread, it was the small Hetzner VPS with the Intel CPU. With two threads, the RackNerd server took the lead, closely followed by the Intel NUC. With four threads, the Contabo server’s memory processed the most operations.
Sysbench Fileio
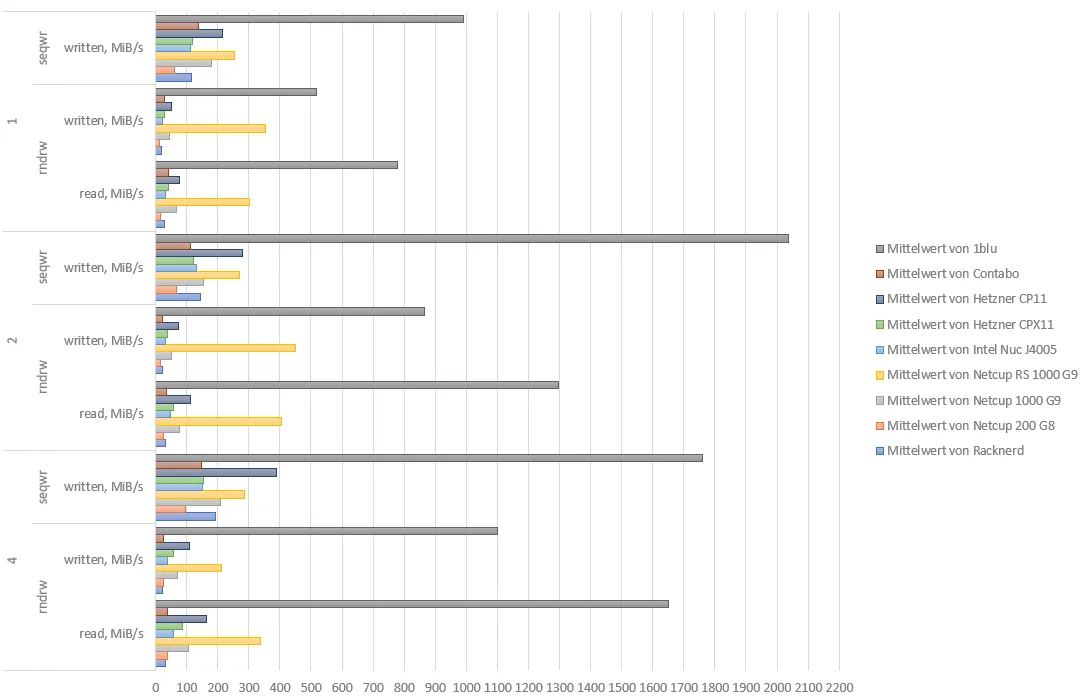
The 1blu server achieved the best results in write and read speed by a wide margin. Unfortunately, I don’t have a second server with this provider to test whether this was an outlier. For easier comparison of the remaining results, I created another chart without 1blu.
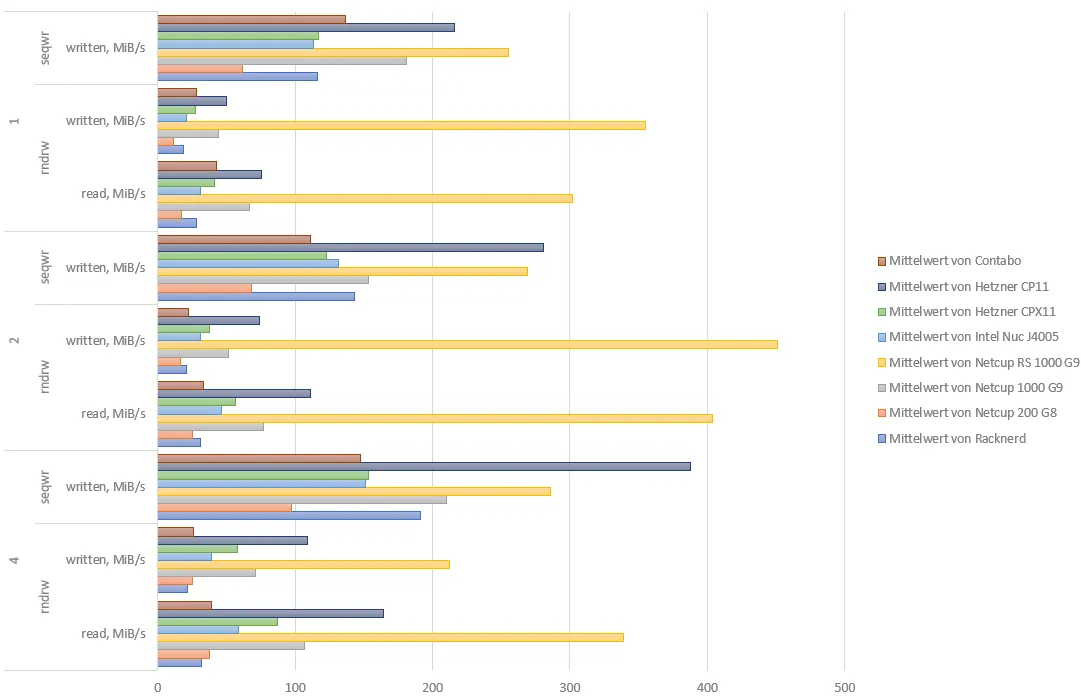
Netcup’s root server came a distant second, followed by the Hetzner VPS with the Intel CPU. I’m surprised by the large gap between the Hetzner VPS with the Intel CPU (CX11) and the Hetzner VPS with the AMD CPU (CPX11), since I’d assume both use the same type of storage.
I also tried this test on a Raspberry Pi 3B+ (Amazon Affiliate Link) with 1 GB RAM and a 32 GB Samsung Evo Plus MicroSD (Amazon Affiliate Link). All results were below 10 MiB/s, which is why I wouldn’t use a Raspberry Pi with a MicroSD card for processes that require many write operations. The I/O is simply too slow.
7zip
1 Thread
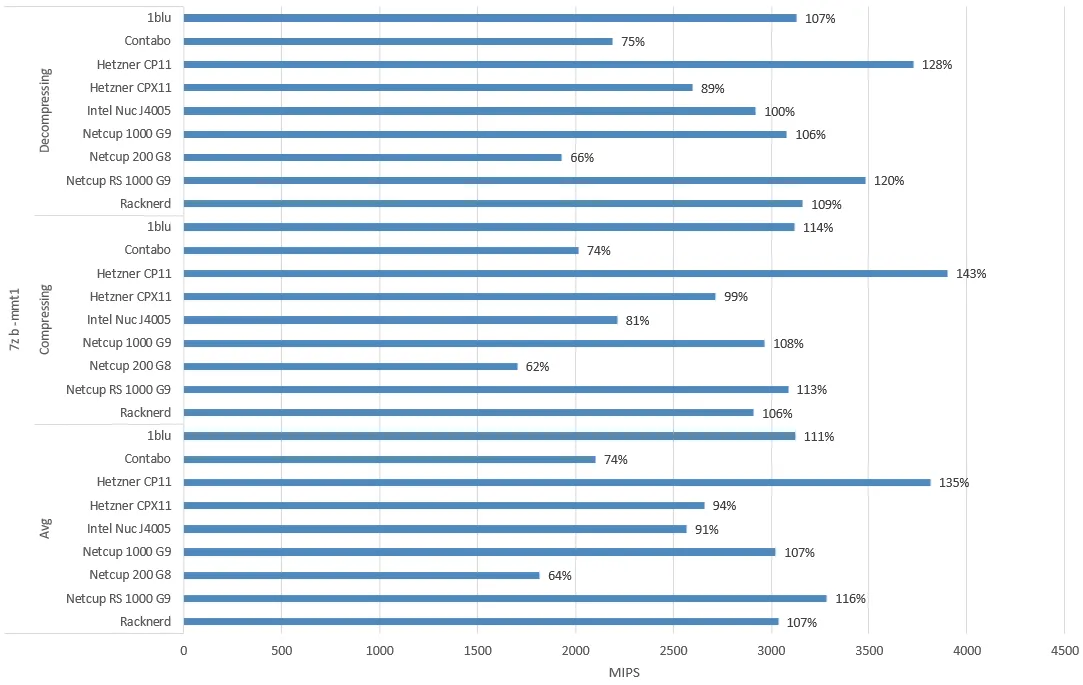
In the 7zip benchmark with only one thread, the Hetzner CX11 server achieved the best results.
2 Threads
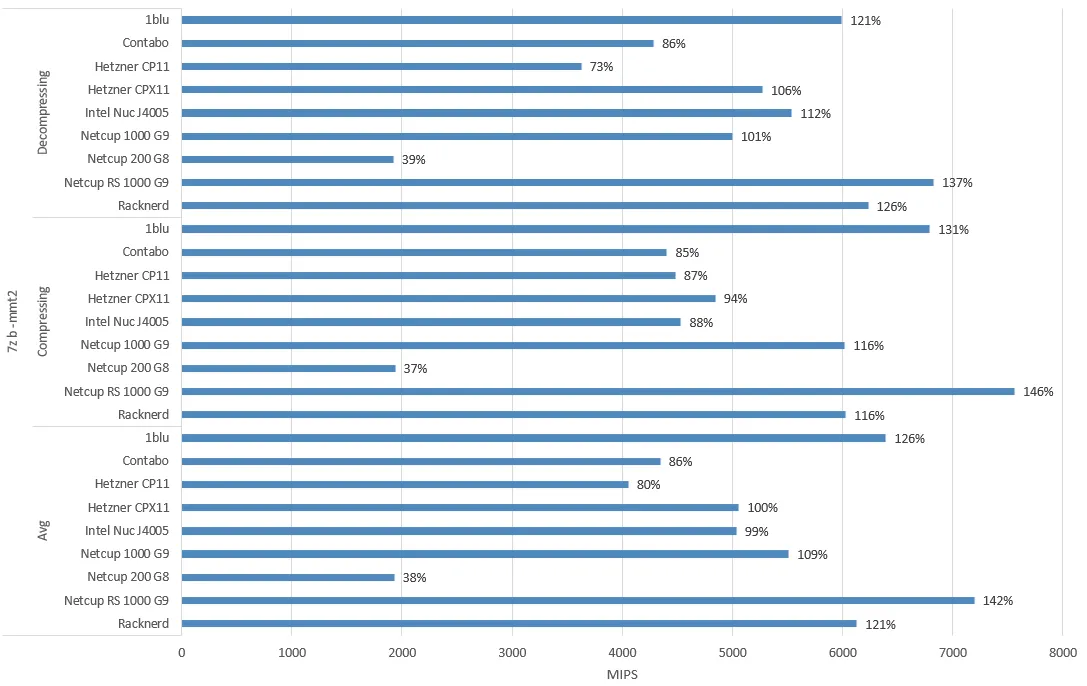
From two threads onwards, the 1blu server achieved the highest MIPS.
4 Threads
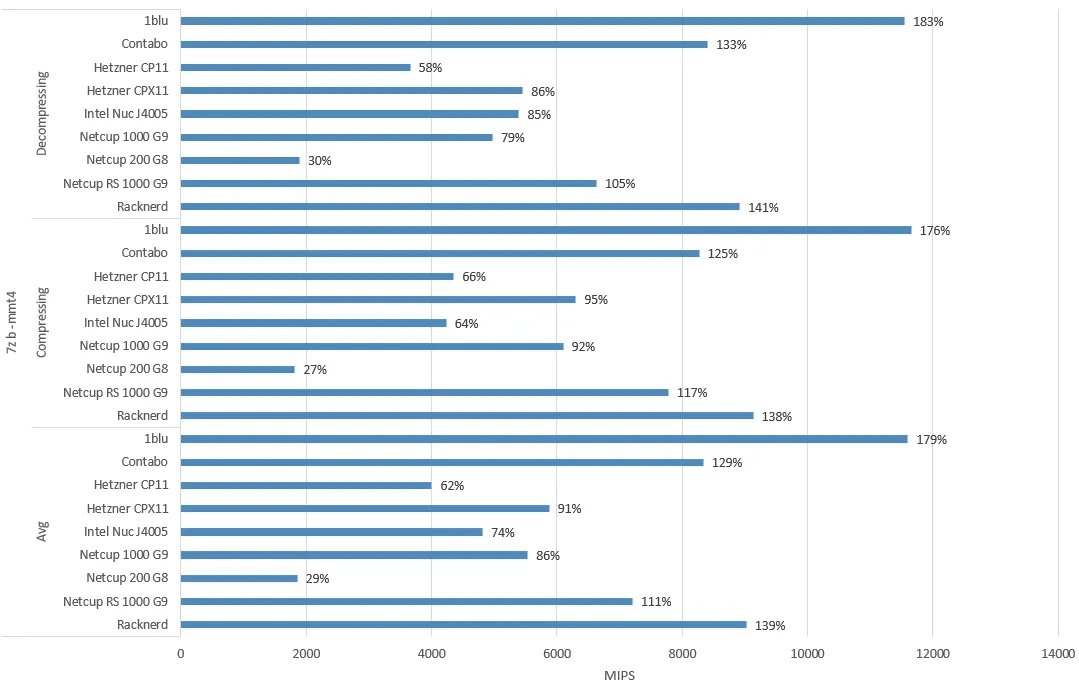
With four threads, the 1blu server extended its lead even further.
Geekbench
In the Geekbench test, I also included three Android smartphones for comparison.
The Netcup root server achieved the highest single-core score. In the multi-core score, it was beaten by the 1blu server.
Phoronix John-the-ripper
The 1blu server also achieved the best result in the John-the-ripper test within the Phoronix test suite. The RackNerd server took second place here.
Phoronix Nginx
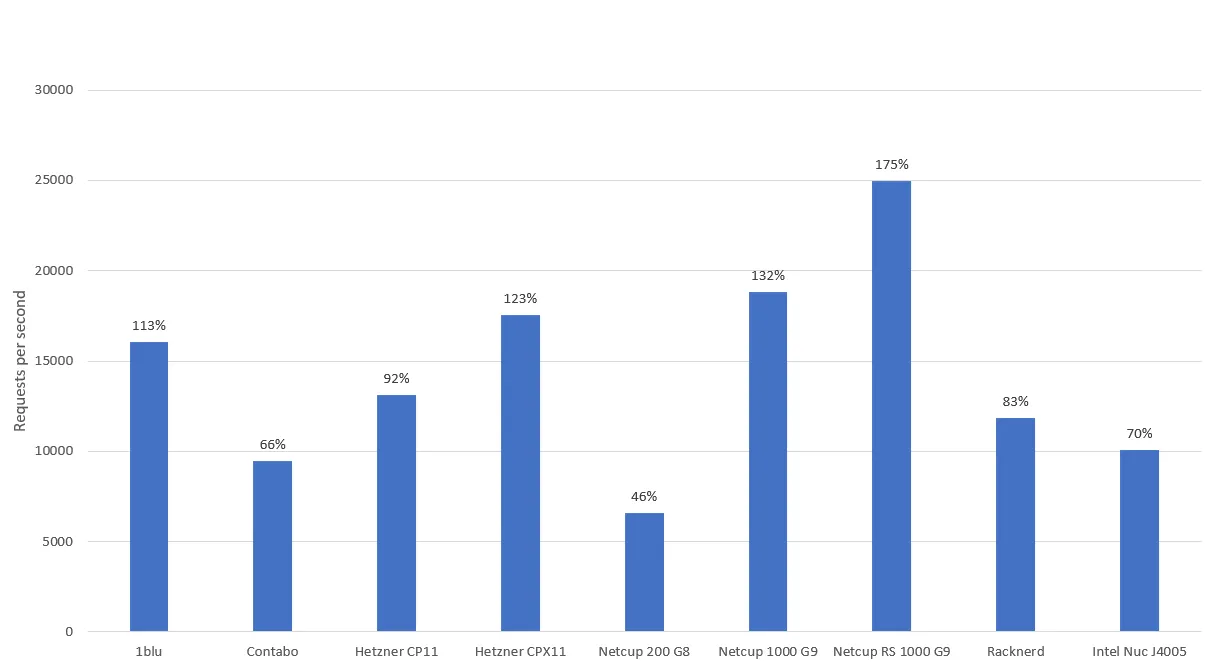
In the Nginx server test, servers with AMD CPUs achieved the best results. In 3rd place was the Hetzner CPX11, in 2nd place the Netcup VPS 1000 G9, and the Netcup root server 1000 G9 processed the most requests.
Benchmarks Late 2021: Yet-Another-Bench-Script
For the second test round, I used the Yet-Another-Bench-Script (YABS). It automatically tests disk write and read speeds with FIO, network speed with iperf, and CPU performance with Geekbench. All servers ran Ubuntu 20.04. For Docker-based benchmarks, check my Ubuntu vs. Debian as Docker host comparison.
FIO: Disk Performance
The first test measures write and read speeds with FIO using different block sizes.
4k Blocks
Results in MB/s (higher is better). The Hetzner VPS in Helsinki was the fastest here. Strangely, the Netcup VPS was faster than the root server.
64k Blocks
Results in GB/s (higher is better). This time the Hetzner VPS in Falkenstein achieved the highest speed.
512k Blocks
Results in GB/s (higher is better). From a block size of 512k onwards, the Netcup servers perform best. The VPS R8 from 1blu and the VPS S SSD from Contabo fall far behind here.
1m Blocks
Results in GB/s (higher is better). Results here are similar to 512k.
FIO Total
iperf: Network Speed
The next test is iperf, a speed test tool for TCP, UDP and SCTP.
The servers were connected to the following providers during the test:
| Provider | Location |
|---|---|
| Clouvider | London, UK |
| Online.net | Paris, FR |
| Clouvider | NYC, NY, US |
| Velocity Online | Tallahassee, FL, US |
| Clouvider | Los Angeles, CA, US |
| Iveloz Telecom | Sao Paulo, BR |
Both download and upload speeds were measured with IPv4. Figures are in Gbit/s:
London, UK
Paris, FR
NYC, NY, US
Tallahassee, FL, US
Los Angeles, CA, US
Sao Paulo, BR
iperf Summary
The Hetzner VPS are far ahead in this area. The downside of Hetzner cloud servers is that additional costs are incurred once monthly outgoing data exceeds 20 TB. However, 20 TB should be more than enough for most purposes.
The other servers are slower, but according to Speedtest, the average internet speed in Germany in January 2022 was 69.52 Mbit/s for downloads and 23.16 Mbit/s for uploads. Almost all results exceed these values.
Geekbench
The final test is Geekbench.
Geekbench 4
Geekbench 5
Geekbench Result
Percentage comparison: Netcup’s root server leads this test. In single-core scores, the Netcup VPS follows, then the Hetzner VPS and the 1blu VPS. In the multi-core test, VPS with only one CPU core naturally perform worse. The Contabo and 1blu servers with four virtual cores each have the biggest advantage here. However, they can’t quite match the dedicated CPU performance of the root server with 2 cores.
Conclusion
What did both test rounds show? Hetzner and Netcup consistently deliver good results, both in CPU performance and in I/O and network speed. The 1blu VPS R8 scores well with four cores for CPU-intensive tasks, but falls behind in the FIO test at larger block sizes.
If you’re looking for an affordable entry point, the Hetzner CX11 is a solid choice. For more dedicated power, the Netcup root server is worth considering. I’ve covered the basics of choosing the right VPS in the VPS beginner guide.
FAQ
How reliable are VPS benchmarks?
Which VPS benchmark tool is the best?
How much RAM does a VPS need?
Which provider is the cheapest?
Netcup Discount Vouchers
The test results were not sponsored by anyone. New Netcup customers can use my Netcup affiliate vouchers to get a server at a lower price. You get a discount on your order, and I receive a commission.
In my opinion, the extra cost for a root server is worth it in most cases, as long as you don’t mind committing to a 12-month contract.
Raw Data
I’ve also copied the benchmark test results into a Google spreadsheet, which can be viewed here.
Changelog
Merged benchmarks from 2021 post.
Related Articles
Ubuntu 24.04 vs. Debian 13: Docker Performance Benchmark
Is Debian really leaner and faster than Ubuntu? I benchmarked both operating systems as Docker hosts using a comprehensive script to find the real answer.
Linux Terminal for Beginners: Essential Commands for Servers
Master essential Linux terminal commands for your server. A beginner-friendly guide with practical examples for navigation, file management, and SSH admin!
Set up server with Traefik as reverse proxy for Docker
Set up your server with Docker and configure Traefik as a reverse proxy using Docker Compose. Get automatic SSL certificates and secure container management.
VPS for Beginners: Your Guide to Choosing and Securing
Choose and secure your first VPS step-by-step: system updates, new user, SSH keys, and firewall setup. The ideal starting point for self-hosting with Docker.