Combine and Pivot Text Data in Excel Using PowerQuery
Combine text columns and pivot datasets in Excel using PowerQuery. Learn how to merge and transform data efficiently with practical examples. Step-by-step tutorial.
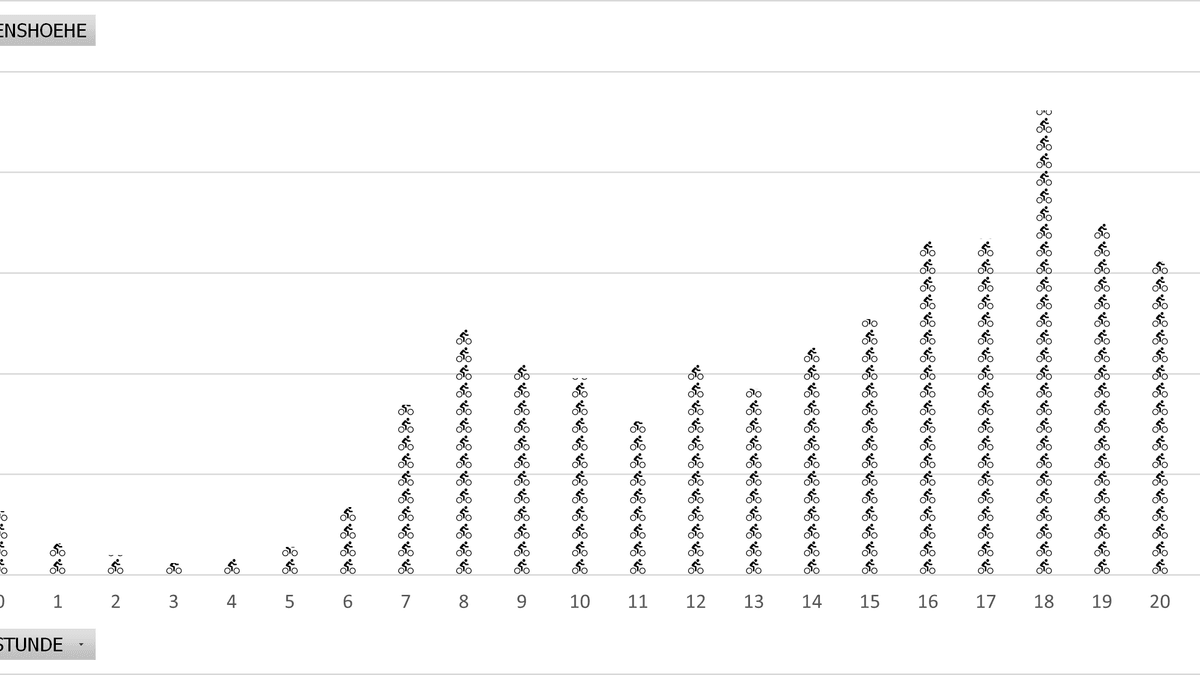
Table of Contents
CAUTION
Please note that initially, I wrote this blog post in German. This translation is for your convenience. Although every effort has been made to ensure accuracy, there may be translation errors. I apologize for any discrepancies or misunderstandings resulting from the translation. I am grateful for any corrections in the comments or via mail.
Today we are going to talk about data manipulation with Excel.
Main Problem
I have a table with multiple columns
| Column 1 | Column 2 |
|---|---|
| A | 1 |
| A | 2 |
| B | 3 |
| A | 2 |
| B | 4 |
I want to pivot this table, but I don’t want to calculate the sums:
| Column 1 | Column 2 |
|---|---|
| A | 5 |
| B | 7 |
Instead, I want to keep the individual entries:
| Column 1 | Column 2 |
|---|---|
| A | 1; 2; 2 |
| B | 3; 4 |
Data Basis
With only five rows, this task is probably faster to do manually than setting up a pivot table or using Power Query. But what if there is a large amount of data?
For this example, I will download a CSV file containing information on bicycle thefts in Berlin since January 1, 2021 from the Berlin Police website: Fahrraddiebstahl.csv.
At the time of download, the CSV file contains 23,873 rows. Manual editing is no longer feasible.
Preparation
First, I save the file as *.xlsx ab. without making any changes. Then, I select column A and use the “Text to Columns” feature to split the values based on a comma (,).
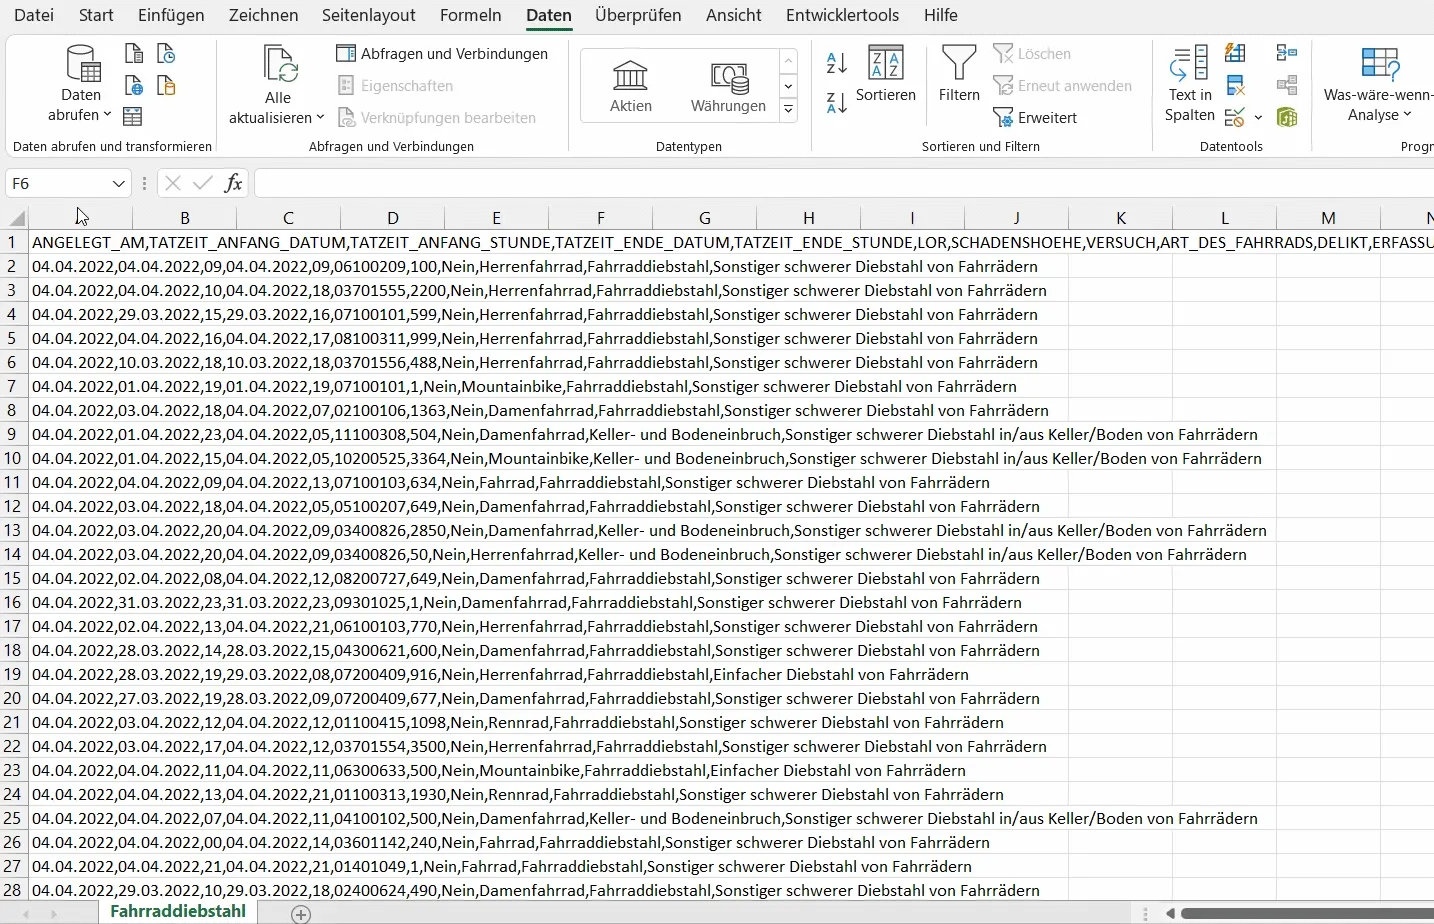
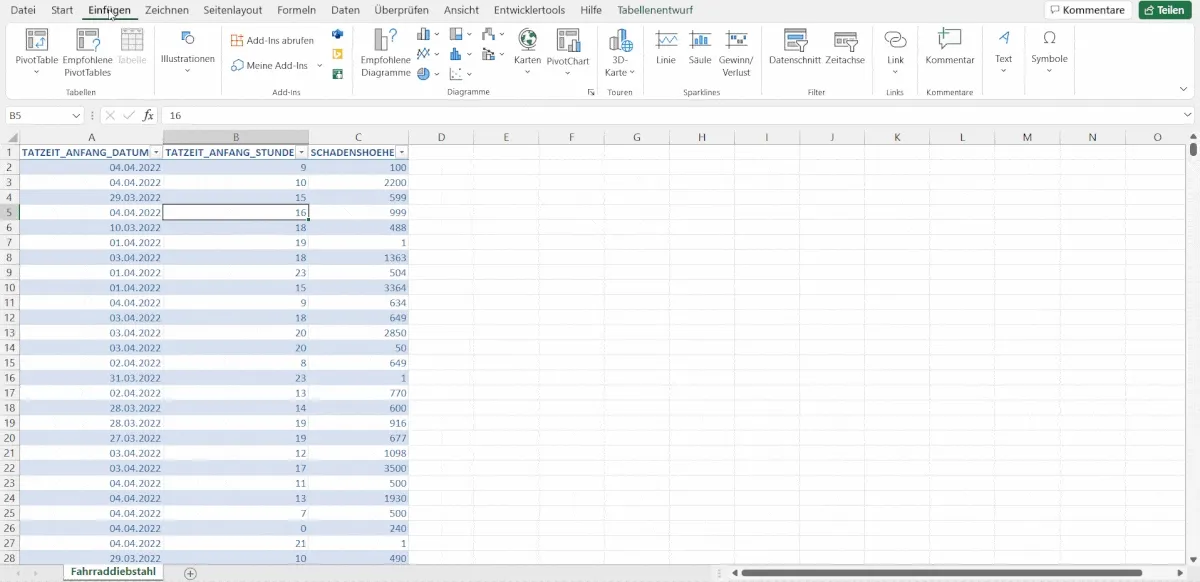
For the purpose of this demonstration, I only need three columns. I delete all other columns except for “TATZEIT_ANFANG_DATUM” (crime start date), “TATZEIT_ANFANG_STUNDE” (crime start hour), and “SCHADENSHÖHE” (damage amount).
Next, I convert the data range into a table (CTRL+T).
Data Analysis
In reality, what I am trying to achieve with this table is not very useful. If I wanted to analyze something, I would probably create a pivot table.
For example, you can quickly see at which hour the most damage occurs.
Some media companies would probably start this blog post with something like: “You would never believe at what time most bicycles are stolen!” Answer: The most common start time is at 6 PM. Of course, this does not account for unreported cases.
Power Query
Now let’s get to the main task. I load the table into Power Query by selecting the table and then choosing From Table/Range under the “Data” menu.
The table will open in the Power Query Editor.
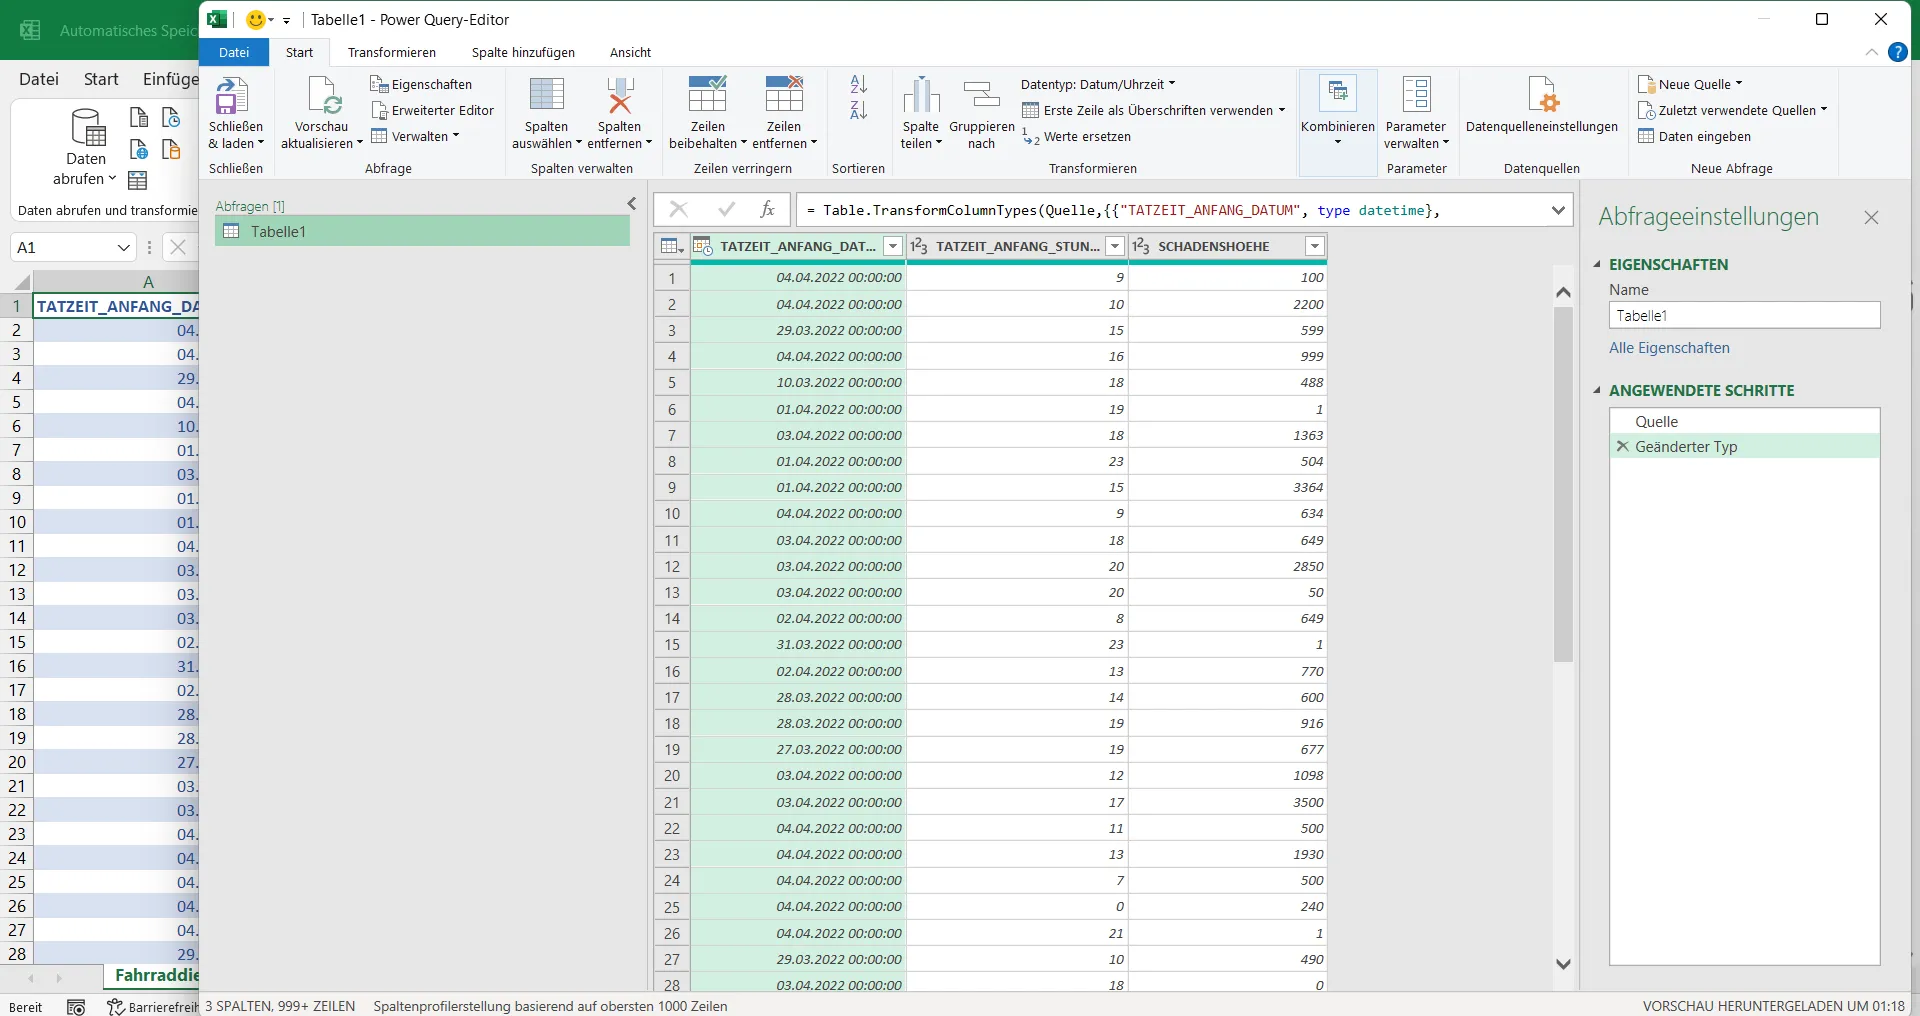
Next, I change the data types.
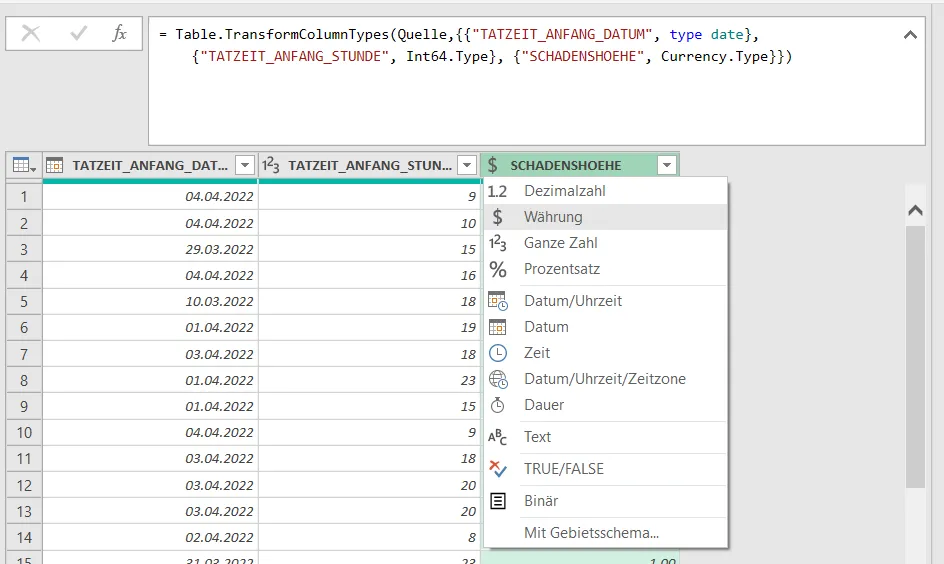
= Table.TransformColumnTypes(Quelle,{{"TATZEIT_ANFANG_DATUM", type date}, {"TATZEIT_ANFANG_STUNDE", Int64.Type}, {"SCHADENSHOEHE", Currency.Type}})Text.Combine
Next, I add a new column where I finally use the Text.Combine function in its regular form.
= Table.AddColumn(#"Changed Type", "TATZEIT_ANFANG", each Text.Combine({Text.From([TATZEIT_ANFANG_DATUM], "en-US"), " ", Text.PadStart(Text.From([TATZEIT_ANFANG_STUNDE], "en-US"), 2, "0"), ":00:00"}), type text)This combines the date and time into a single column.
Using Text.Combine, I have merged the columns from each row.
Now I can remove the individual columns.
= Table.SelectColumns(#"Added Custom",{"TATZEIT_ANFANG","SCHADENSHOEHE"})I can now sort the table in ascending order.
= Table.Sort(#"Removed Other Columns",{{"TATZEIT_ANFANG", Order.Ascending}})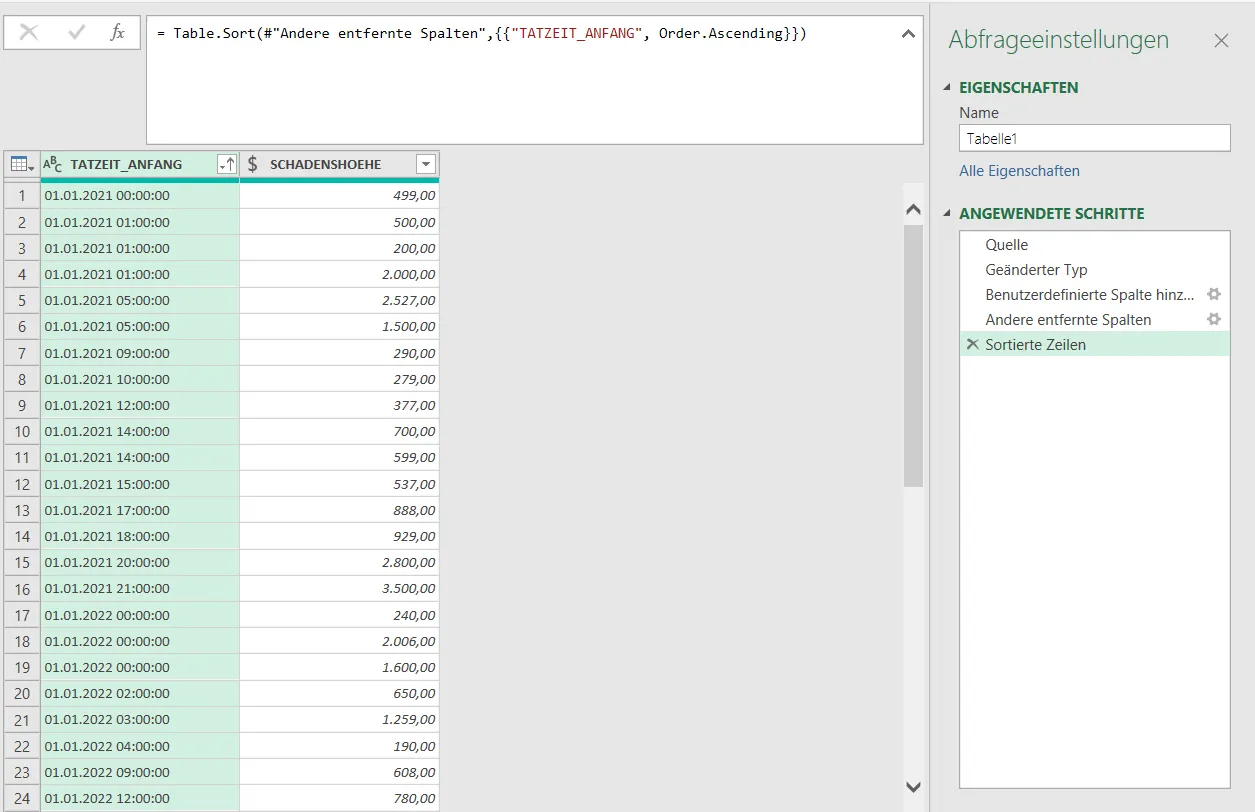
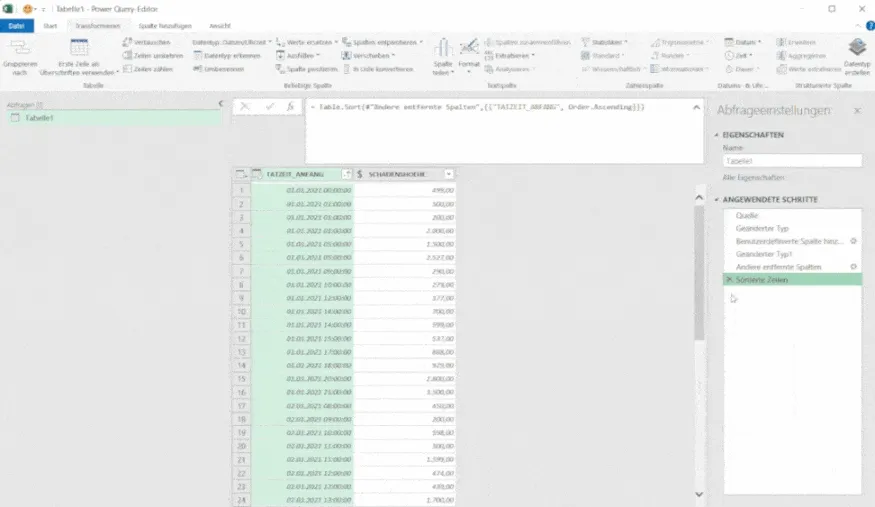
Tabelle Gruppieren
Now I select the first column and click on “Group By”.
I group by the sum of the damage amount. Then I get the sum as well. But if I want concatenated texts, I change the data type to text and modify the formula from List.Sum to Text.Combine. In this case, a second parameter also needs to be passed.
Finally, I split the content of the column based on this parameter and then load the final table.
In the Advanced Editor, the formula looks like this:
let
    Source = Excel.CurrentWorkbook(){[Name="Table1"]}[Content],
    #"Changed Type" = Table.TransformColumnTypes(Source,{{"TATZEIT_ANFANG_DATUM", type date}, {"TATZEIT_ANFANG_STUNDE", Int64.Type}, {"SCHADENSHOEHE", Currency.Type}}),
    #"Added Custom" = Table.AddColumn(#"Changed Type", "TATZEIT_ANFANG", each Text.Combine({Text.From([TATZEIT_ANFANG_DATUM], "en-US"), " ", Text.PadStart(Text.From([TATZEIT_ANFANG_STUNDE], "en-US"), 2, "0"), ":00:00"}), type text),
    #"Changed Type1" = Table.TransformColumnTypes(#"Added Custom",{{"TATZEIT_ANFANG", type datetime}}),
    #"Removed Other Columns" = Table.SelectColumns(#"Changed Type1",{ "TATZEIT_ANFANG","SCHADENSHOEHE"}),
    #"Sorted Rows" = Table.Sort(#"Removed Other Columns",{{"TATZEIT_ANFANG", Order.Ascending}}),
    #"Changed Type2" = Table.TransformColumnTypes(#"Sorted Rows",{{"SCHADENSHOEHE", type text}}),
    #"Grouped Rows" = Table.Group(#"Changed Type2", {"TATZEIT_ANFANG"}, {{"SCHADEN", each Text.Combine([SCHADENSHOEHE],"; "), type text}}),
    #"Sorted Rows1" = Table.Sort(#"Grouped Rows",{{"TATZEIT_ANFANG", Order.Ascending}}),
    #"Split Column by Delimiter" = Table.SplitColumn(#"Sorted Rows1", "SCHADEN", Splitter.SplitTextByDelimiter(";", QuoteStyle.Csv), {"SCHADEN.1", "SCHADEN.2", "SCHADEN.3", "SCHADEN.4", "SCHADEN.5", "SCHADEN.6", "SCHADEN.7"}),
    #"Changed Type3" = Table.TransformColumnTypes(#"Split Column by Delimiter",{{"SCHADEN.1", Int64.Type}, {"SCHADEN.2", Int64.Type}, {"SCHADEN.3", Int64.Type}, {"SCHADEN.4", Int64.Type}, {"SCHADEN.5", Int64.Type}, {"SCHADEN.6", Int64.Type}, {"SCHADEN.7", Int64.Type}})
in
    #"Changed Type3"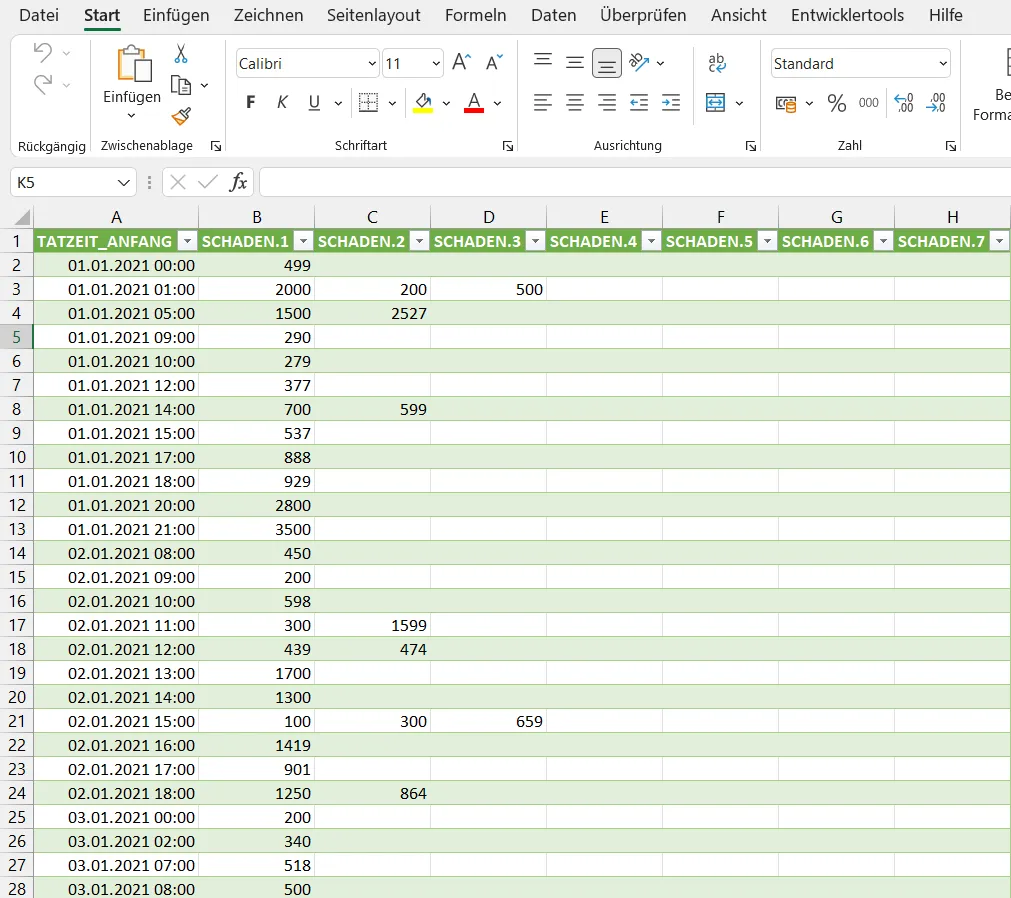
In this table, you can see that there are a maximum of seven entries for each hour and how the damage amounts are divided.
If you have any questions, comments, etc., please write them in the comments section.
Related Articles
Excel XLOOKUP vs VLOOKUP: Speed and Performance Compared
Excel's XLOOKUP replaces VLOOKUP in Office 365. Compare XLOOKUP, VLOOKUP, and INDEX with real benchmarks to see which formula is fastest. Data-driven analysis.
Excel VLOOKUP Function Tutorial - Use VLOOKUP in Excel
The VLOOKUP function in Excel explained simply: Learn how to reliably search data in tables, apply the formula correctly, and discover useful alternatives.
Excel: Group and Sort Table Data Dynamically with Formulas
Group and sort data from an Excel table dynamically using formulas. No pivot tables needed, so you keep full control over your data analysis and evaluations.
Build a Blog with Gatsby.js and Ghost CMS on Your VPS
Step-by-step guide: Build a blog with Gatsby.js and Ghost as a headless CMS. Set up everything on your VPS, configure Docker, and publish your website.